Generate an Explainability Report with the Automobile dataset using Contextual AI
This notebook demonstrates how to generate an explainability report using the Contextual AI compiler.
Motivation
When it comes to putting your machine learning model into production, one may need to consider the following:
How can you compare newly trained models with previous versions?
How can you present your new model’s results to non-technical users (e.g. managers, business developers) in an intuitive manner?
How can you establish trust between your machine learning model and its end-users?
The Contextual AI project attempts to address these questions by providing interpretability and explanations throughout the lifecycle of a ML solution, including: 1. The data itself, allowing for robust data validation and intuitive visualisations 2. The training/validation processes of model, allowing users to understand how well the model trained and which features were important 3. The predictions, allowing for users to understand why a model exhibited particular behavior
For more details, please refer to our whitepaper
Steps
Train a model on the automobile dataset
Evaluate the model’s performance with Contextual AI report
1. Performance Model Training
[1]:
import numpy as np
import pandas as pd
import warnings
1.1 Loading Data
[2]:
data = pd.read_csv("Automobile_data.csv")
data.describe
[2]:
<bound method NDFrame.describe of      symboling normalized-losses         make fuel-type aspiration  \
0            3                 ?  alfa-romero       gas        std
1            3                 ?  alfa-romero       gas        std
2            1                 ?  alfa-romero       gas        std
3            2               164         audi       gas        std
4            2               164         audi       gas        std
..         ...               ...          ...       ...        ...
200         -1                95        volvo       gas        std
201         -1                95        volvo       gas      turbo
202         -1                95        volvo       gas        std
203         -1                95        volvo    diesel      turbo
204         -1                95        volvo       gas      turbo

    num-of-doors   body-style drive-wheels engine-location  wheel-base  ...  \
0            two  convertible          rwd           front        88.6  ...
1            two  convertible          rwd           front        88.6  ...
2            two    hatchback          rwd           front        94.5  ...
3           four        sedan          fwd           front        99.8  ...
4           four        sedan          4wd           front        99.4  ...
..           ...          ...          ...             ...         ...  ...
200         four        sedan          rwd           front       109.1  ...
201         four        sedan          rwd           front       109.1  ...
202         four        sedan          rwd           front       109.1  ...
203         four        sedan          rwd           front       109.1  ...
204         four        sedan          rwd           front       109.1  ...

     engine-size  fuel-system  bore  stroke compression-ratio horsepower  \
0            130         mpfi  3.47    2.68               9.0        111
1            130         mpfi  3.47    2.68               9.0        111
2            152         mpfi  2.68    3.47               9.0        154
3            109         mpfi  3.19     3.4              10.0        102
4            136         mpfi  3.19     3.4               8.0        115
..           ...          ...   ...     ...               ...        ...
200          141         mpfi  3.78    3.15               9.5        114
201          141         mpfi  3.78    3.15               8.7        160
202          173         mpfi  3.58    2.87               8.8        134
203          145          idi  3.01     3.4              23.0        106
204          141         mpfi  3.78    3.15               9.5        114

     peak-rpm city-mpg highway-mpg  price
0        5000       21          27  13495
1        5000       21          27  16500
2        5000       19          26  16500
3        5500       24          30  13950
4        5500       18          22  17450
..        ...      ...         ...    ...
200      5400       23          28  16845
201      5300       19          25  19045
202      5500       18          23  21485
203      4800       26          27  22470
204      5400       19          25  22625

[205 rows x 26 columns]>
1.2 Quick Check
[3]:
data.isnull().sum()
[3]:
symboling            0
normalized-losses    0
make                 0
fuel-type            0
aspiration           0
num-of-doors         0
body-style           0
drive-wheels         0
engine-location      0
wheel-base           0
length               0
width                0
height               0
curb-weight          0
engine-type          0
num-of-cylinders     0
engine-size          0
fuel-system          0
bore                 0
stroke               0
compression-ratio    0
horsepower           0
peak-rpm             0
city-mpg             0
highway-mpg          0
price                0
dtype: int64
1.3 Feature quantity engineering
[4]:
#normalized-losses
a=data[data['normalized-losses']!='?']
b=(a['normalized-losses'].astype(int)).mean()
data['normalized-losses']=data['normalized-losses'].replace('?',b).astype(int)

#num-of-doors
a=data[data['body-style']=='sedan']
a['num-of-doors'].value_counts()
a=data['num-of-doors'].map({'two':2,'four':4,'?':4})
data['num-of-doors']=a

#price
a=data[data['price']!='?']
b=(a['price'].astype(int)).mean()
data['price']=data['price'].replace('?',b).astype(int)

#horse power
a=data[data['horsepower']!='?']
b=(a['horsepower'].astype(int)).mean()
data['horsepower']=data['horsepower'].replace('?',b).astype(int)

#bore
a=data[data['bore']!='?']
b=(a['bore'].astype(float)).mean()
data['bore']=data['bore'].replace('?',b).astype(float)

#stroke
a=data[data['stroke']!='?']
b=(a['stroke'].astype(float)).mean()
data['stroke']=data['stroke'].replace('?',b).astype(float)

#peak-rpm
a=data[data['peak-rpm']!='?']
b=(a['peak-rpm'].astype(float)).mean()
data['peak-rpm']=data['peak-rpm'].replace('?',b).astype(float)

#num-of-cylinders
a=data['num-of-cylinders'].map({'four':4,'five':5,'six':6,'?':4})
data['num-of-doors']=a

data.describe()
[4]:
| symboling | normalized-losses | num-of-doors | wheel-base | length | width | height | curb-weight | engine-size | bore | stroke | compression-ratio | horsepower | peak-rpm | city-mpg | highway-mpg | price | |
|---|---|---|---|---|---|---|---|---|---|---|---|---|---|---|---|---|---|
| count | 205.000000 | 205.000000 | 194.000000 | 205.000000 | 205.000000 | 205.000000 | 205.000000 | 205.000000 | 205.000000 | 205.000000 | 205.000000 | 205.000000 | 205.000000 | 205.000000 | 205.000000 | 205.000000 | 205.000000 |
| mean | 0.834146 | 122.000000 | 4.304124 | 98.756585 | 174.049268 | 65.907805 | 53.724878 | 2555.565854 | 126.907317 | 3.329751 | 3.255423 | 10.142537 | 104.253659 | 5125.369458 | 25.219512 | 30.751220 | 13207.126829 |
| std | 1.245307 | 31.681008 | 0.679289 | 6.021776 | 12.337289 | 2.145204 | 2.443522 | 520.680204 | 41.642693 | 0.270844 | 0.313597 | 3.972040 | 39.519219 | 476.979093 | 6.542142 | 6.886443 | 7868.768212 |
| min | -2.000000 | 65.000000 | 4.000000 | 86.600000 | 141.100000 | 60.300000 | 47.800000 | 1488.000000 | 61.000000 | 2.540000 | 2.070000 | 7.000000 | 48.000000 | 4150.000000 | 13.000000 | 16.000000 | 5118.000000 |
| 25% | 0.000000 | 101.000000 | 4.000000 | 94.500000 | 166.300000 | 64.100000 | 52.000000 | 2145.000000 | 97.000000 | 3.150000 | 3.110000 | 8.600000 | 70.000000 | 4800.000000 | 19.000000 | 25.000000 | 7788.000000 |
| 50% | 1.000000 | 122.000000 | 4.000000 | 97.000000 | 173.200000 | 65.500000 | 54.100000 | 2414.000000 | 120.000000 | 3.310000 | 3.290000 | 9.000000 | 95.000000 | 5200.000000 | 24.000000 | 30.000000 | 10595.000000 |
| 75% | 2.000000 | 137.000000 | 4.000000 | 102.400000 | 183.100000 | 66.900000 | 55.500000 | 2935.000000 | 141.000000 | 3.580000 | 3.410000 | 9.400000 | 116.000000 | 5500.000000 | 30.000000 | 34.000000 | 16500.000000 |
| max | 3.000000 | 256.000000 | 6.000000 | 120.900000 | 208.100000 | 72.300000 | 59.800000 | 4066.000000 | 326.000000 | 3.940000 | 4.170000 | 23.000000 | 288.000000 | 6600.000000 | 49.000000 | 54.000000 | 45400.000000 |
1.4 Understanding the range of important features¶¶
[5]:
import matplotlib.pyplot as plt
plt.style.use('seaborn')
import seaborn as sns

data[['engine-size','peak-rpm','curb-weight','horsepower','price','highway-mpg']].hist(figsize=(10,8),bins=6,color='g',linewidth='3',edgecolor='k')
plt.tight_layout()
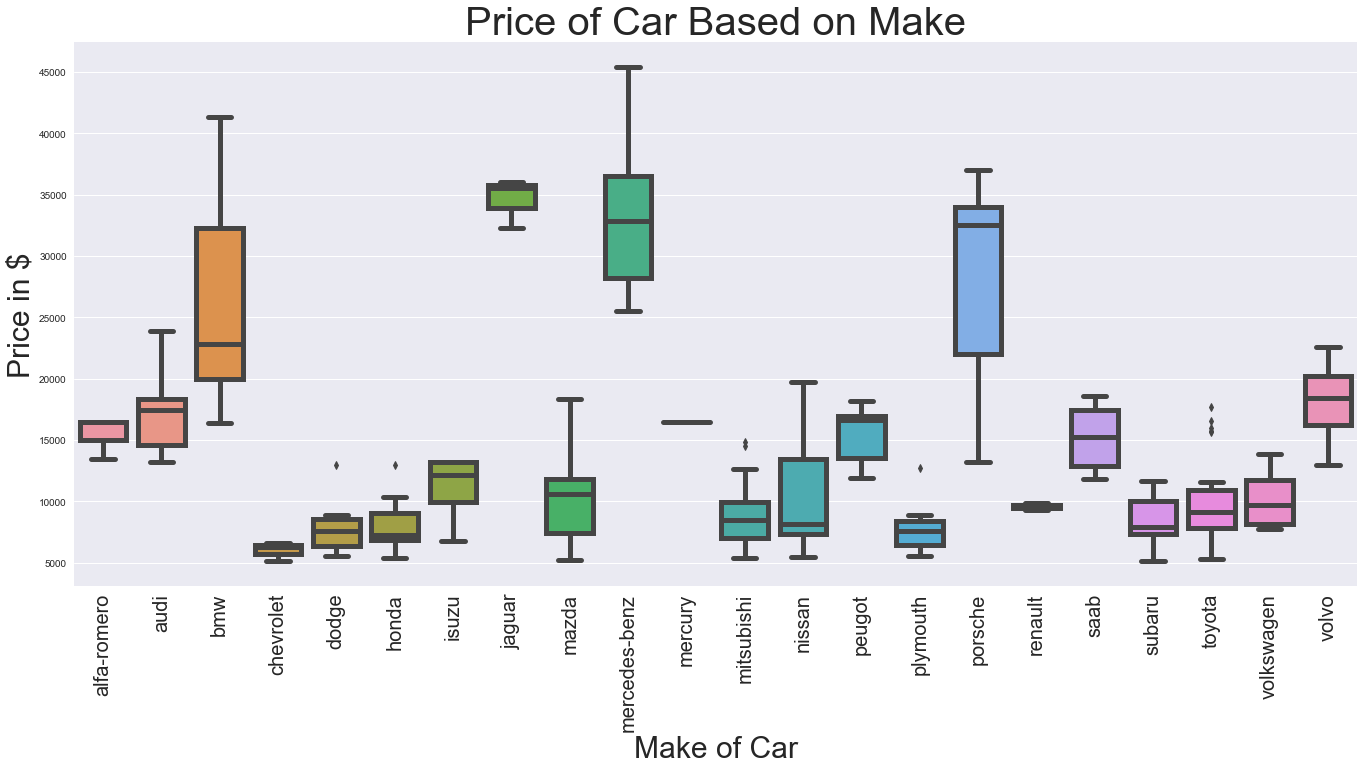
1.5 Getting the Price of car based on make
[6]:
plt.rcParams['figure.figsize']=(23,10)
ax = sns.boxplot(x="make", y="price", data=data,width=0.8,linewidth=5)
ax.set_xlabel('Make of Car',fontsize=30)
ax.set_ylabel('Price in $',fontsize=30)
plt.title('Price of Car Based on Make',fontsize=40)
ax.tick_params(axis='x',labelsize=20,rotation=90)
1.6 Data split
[7]:
from sklearn.model_selection import train_test_split

x = data[['curb-weight','engine-size','horsepower','width']]
y = data['price']

x_train, x_test, y_train, y_test = train_test_split(x, y, test_size=0.2)

x_train.to_csv("train_data.csv", index=False)
x_train.head()
[7]:
| curb-weight | engine-size | horsepower | width | |
|---|---|---|---|---|
| 165 | 2265 | 98 | 112 | 64.0 |
| 41 | 2465 | 110 | 101 | 65.2 |
| 120 | 1967 | 90 | 68 | 63.8 |
| 161 | 2122 | 98 | 70 | 64.4 |
| 140 | 2240 | 108 | 73 | 63.8 |
1.7 Model Training
[10]:
import pickle
from sklearn.tree import DecisionTreeClassifier
model = DecisionTreeClassifier()
model.fit(x_train,y_train)

pkl = open('model.pkl', 'wb')
pickle.dump(model, pkl)
model = None
1.5 ML load model and evaluation
[11]:
model_pkl = open('model.pkl', 'rb')
model = pickle.load(model_pkl)

accuracy = round(model.score(x_train, y_train) * 100, 2)
print("Model Accuracy: ", accuracy)
Model Accuracy: 94.51
2. Involve Contextual AI complier
[12]:
import os
import sys
sys.path.append('../../../')
from xai.compiler.base import Configuration, Controller
2.1 Specify config file
[13]:
json_config = 'basic-report.json'
2.2 Initial compiler controller with config
[14]:
controller = Controller(config=Configuration(json_config))
print(controller.config)
{'name': 'Report for Automobile Dataset', 'overview': True, 'content_table': True, 'contents': [{'title': 'Feature Importance Analysis', 'desc': 'This section provides the analysis on feature', 'sections': [{'title': 'Feature Importance Ranking', 'component': {'_comment': 'refer to document section xxxx', 'class': 'FeatureImportanceRanking', 'attr': {'trained_model': 'model.pkl', 'train_data': 'train_data.csv'}}}]}, {'title': 'Data Statistics Analysis', 'desc': 'This section provides the analysis on data', 'sections': [{'title': 'Simple Data Statistic', 'component': {'_comment': 'refer to document section xxxx', 'class': 'DataStatisticsAnalysis', 'attr': {'data': 'Automobile_data.csv'}}}]}], 'writers': [{'class': 'Pdf', 'attr': {'name': 'automobile-basic-report'}}]}
2.2 Finally compiler render
[15]:
controller.render()
../../../xai/data/helper.py:189: UserWarning: Warning: the feature [price] is suspected to be identifiable feature.
[Examples]: ['13495', '16500', '16500', '13950', '17450']

  '[Examples]: %s\n' % (column, col_data.tolist()[:5]))
Result
[17]:
print("report generated : %s/automobile-basic-report.pdf" % os.getcwd())
report generated : /Users/i062308/Development/Explainable_AI/tutorials/compiler/automobile/automobile-basic-report.pdf
[ ]: